 Research Article
Correlation, Path Coefficient and Multivariate Analysis for Yield and Yield-associated Traits among Potato (Solanum tuberosum L.) Genotypes Grown in Eastern Ethiopia
Habtamu Gebreselassie* and Leta Ajema
Ethiopian Institute of Agricultural Research, Wondo Genet Center, Shashemene, Ethiopia.
Ethiopian Institute of Agricultural Research, Wondo Genet Center, Shashemene, Ethiopia
Received Date: July 09, 2022; Published Date: September 09, 2022
<Abstract
Genotypic, phenotypic correlation coefficients, and path coefficients analysis as well as cluster and principal component analysis were done for 15 quantitative traits of yield and its related characters among 18 Potato genotypes in Eastern Ethiopia. The experiment was carried out using Randomized Complete Block Design with three replication data were collected for yield and yield-related traits using standard procedure. The results revealed that tuber yield was found to be significantly and positively correlated with marketable tuber yield, large tuber number, large tuber weight, and starch content, while negatively and significantly correlated with small tuber weight both at the genotypic and phenotypic level. Path analysis indicated that total tuber yield was directly associated with marketable tuber yield, average tuber weight, large tuber weight, large tuber number, dry matter content, and total soluble solids and starch content. Based on the complete linkage method of cluster analysis using Euclidian distance, the studied potato genotypes were congregated into different clusters confirming the existence of a high genetic divergence among the studied genotypes. Principal component analysis revealed that the first five principal components accounted for 92.2% of the observed variations among 18 potato genotypes. Of these, the first, the second, the third, the fourth, and the fifth principal components explained 55.33%, 17.18%, and 9.17%, 6.18% & 4.33% of the variation, respectively. In conclusion, the traits that were directly associated with tuber yield should be considered in selection at potato improvement programs that aim to increasing tuber yield. Variety Belete, which was grouped in the first sub-cluster of the first main cluster, was the most superior yielder variety among the tested varieties and local cultivars and therefore could be exploited in potato breeding to improve total tuber yield.
Keywords:Potato; Correlation; Path analysis; Diversity; Cluster; Principal component analysis; Tuber yield
Introduction
Potato (Solanum tuberosum L.) is one of the major world’s agricultural root crops, which plays important role in feeding the world. The worldwide total production exceeds 359 million metric tons and this figure was exceedingly only by wheat, maize and rice [1]. Potato is regarded as a high-potential food security crop because of its ability to provide a high yield of high-quality product per unit input with a shorter crop cycle (mostly < 120 days) than major cereal crops like maize [2]. It is nutritious, readily digestible, and wholesome food with a good source of carbohydrates, vitamins, proteins, minerals and dietary fibre.
Potato has been considered as a strategic crop aiming at enhancing food security and economic benefits to the Ethiopia with the total area under potato production estimated at about 70,362 ha, with a total annual production of 924,728 metric tons in 2019 [3]. It is one of the main tuber crops grown by approximately one million farmers in the country [3]. The national average yield is 13.14 t ha-1, which is very low compared to the world average of 20.36 tons ha-1 [3,4]. In Ethiopia, the potential of the potato crop has not been adequately exploited, as is clearly illustrated by the low national yield and small area cropped with it. The major problems that account for such low yields are lack of well adapted cultivars, unavailability and high cost of seed tubers, inappropriate agronomic practices, diseases, insect pests, inadequate storage, transportation and marketing facilities [5].
For efficient and effective breeding work, investigation and better understanding of the variability existing in a population base of a crop is required so that it can be exploited by plant breeders for crop improvement. Genetic diversity is essential to meet the diversified goals of plant breeding such as breeding for increasing yield, wider adaptation, desirable quality, pest and disease resistance. Genetic divergence analysis estimates the extent of diversity existed among selected genotypes [6]. Multivariate statistical tools have found extensive use in summarizing and describing the inherent variation in the population of crop genotypes. Cluster and principal component analysis (PCA) are widely used and useful tools for the determination of genetic relationship among genotypes in crop improvement. This is due to the fact that they group genetically similar genotypes together and create a scatter plot of genotypes with the geometrical distances among them reflecting their genetic distances with minimum distortion, respectively [7-9]. The PCA has been used to partition observed trait variations in genotypes of many crops. Cluster analysis is a classification method, which is used to arrange a set of cases into clusters. The aim of set cases within a cluster is more similar to each other and helps to researchers to give summary information on data [7]. In addition, cluster analysis is being a powerful tool used to exposing of similarity and diversity [10].
Knowledge of correlations among different characteristics is fundamental to designing an effective breeding program in selecting the breeding materials for improving complex characters through indirect selection (Teklewold et al., 2000). Tuber yield is a complex character and economically important, but it is associated with many interrelated components. Therefore, understanding the association of plant characteristics with yield is very much crucial for successful breeding. The correlation coefficient is very important for measuring the degree and direction of linkage of different parameters that affect either positively or negatively the yield [11]. Korkut et al. (1993) described that the simple correlation analysis could not fully give details link among the characters. Therefore, path coefficient analysis is optional to utilize for more and complete determination of impact of independent variable on dependent one. So direct and indirect effects can clearly be understood by path analysis. Many researchers have widely used this analysis to explain the direct and indirect effects of different traits on yield in different crop species. The purpose of this study was to investigate the relationship between tuber yield and its associated traits through correlation & path analyses and analyzing genetic diversity among potato genotypes grown in Eastern Ethiopia.
Materials and Methods
The study was conducted at Rare, Haramaya University Horticulture section’s research field in the Eastern Hararghe zones in 2012 main cropping season. Eighteen potato genotypes, viz., sixteen potato varieties, which were released by Haramaya University and different Research Centers for different agro-ecologies of the country and two local cultivars which were extensively used in East Hararghe zones were evaluated using randomized block design (RBD) with three replications. Each plot was 3.60 m x 4.50 m = 16.2 m2 wide consisting of six rows, which accommodated 12 plants per row and thus 72 plants per plot. The spacing between plots and adjacent replication were 1 m and 1.5 m, respectively. The recommended package of agronomic practices was strictly followed as per the recommendation.
Forty plants from the four middle rows, leaving the plants growing in the two border rows as well as those growing at both ends of each row to avoid edge effects from each replication and data were recorded for the characters viz., total tuber yield (t ha-1), marketable tuber yield (t ha-1), average tuber weight (gm), tuber size distribution in number (%), tuber size distribution in weight (%), tuber dry matter content(%), total starch content (%) and total soluble solid (0Brix).
Data analysis
Genotypic and phenotypic correlations as well as path coefficient analysis were calculated as per [26] by R software using variability package. Principal component analysis (PCA) was done using SAS software to determine the relative importance of the traits responsible for variation among the potato genotypes. Potato genotypes were clustered by R software using variability package with complete linkage method of clustering strategy which group and sort genotypes into clusters to form denderogram [26].
Result and Discussion
Genotypic and phenotypic correlation
The genotypic and phenotypic correlations were studied to know the relationship between tuber yield and its related characters and presented in Table 1. In the present investigation, many of the characters were positively and negatively correlated with each other. Higher genotypic correlation coefficients were noticed than phenotypic correlation coefficients for all the ten characters studied (Table 1), suggesting little influence of environment, and the presence of inherent association between various characters. Many researcher was reported the existence of association between different traits in potato genotype [12-16].
According to this study result, total tuber yield per plot was found to be significantly and positively correlated with marketable tuber yield (0,99 and 0.98), large tuber number (0.5 and 0.48), large tuber weight (0.51 and 0.5), and starch content (0.77 and 0.47), while negatively and significantly correlated with small tuber weight (-0.54 and -0.52) both at genotypic and phenotypic level. Yield is also significantly correlated (0.55) with dry mater content at genotypic level but non-significantly correlated at phenotypic level. This indicated that these characters could be considered as criteria for selecting high yielding genotypes of potato. Correlation revealed the possibility of selecting the plants having characters like more number of stems, more number of tubers per plant, and more tuber weight. The higher magnitude of positive and significant association of total tuber yield with marketable tuber yield, starch content, large tuber number, and large tuber weight suggested that those traits were the principal yield attribute and indicated its importance as yield component in influencing the yield of potato.
Marketable tuber yield positively and significantly correlated with large tuber number (0.57 & 0.57), average tuber weight (0.47 & 0.47), large tuber weight (0.6 & 0.59), dry matter content (0.5 & 0.27) and starch (0.58 and 0.53) both at genotypic and phenotypic level whereas significantly and negatively correlated with small tuber number (-0.53 & -0.51), medium tuber weight (-0.51 & -0.51), small tuber weight (-0.63 & -0.61) at genotypic and phenotypic level respectively (Table 1).
Table 1:Genotypic and phenotypic correlation coefficients among potato genotype traits (below genotypic & above phenotypic correlation).
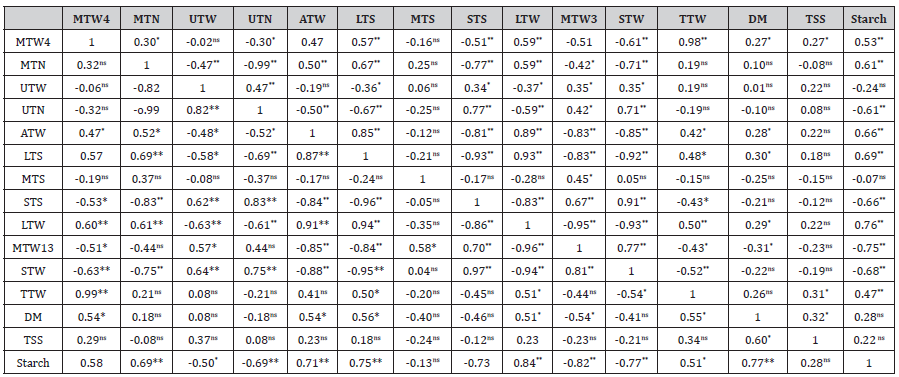
where, TTW=Total tuber yield (t ha-1), MTW4=Marketable tuber yield (t ha-1), MTN=Marketable tuber number (%), ATW=Average tuber weight(gm), LTS=Large tuber number (%), MTS=Medium tuber number (%), STS=Small tuber number (%), LTW=Large tuber weight (%), MTW3=Medium tuber weight (%), STW=Small tuber weight (%), DM=Dry Matter content (%), TSS=Total Soluble Solid (0Brix), Starch=Starch Content (%)
Average tuber weight positively and significantly correlated with large tuber number (0.87 & 0.85), large tuber weight (0.91 & 0.89), dry matter content (0.54 & 0.28), and starch content (0.71 and 0.66) both at genotypic and phenotypic level whereas significantly and negatively correlated with small tuber number (-0.84 & -0.85), medium tuber weight (-0.85 & -0.83), small tuber weight(-0.88 & -0.85) at genotypic and phenotypic level respectively.
Starch content was positively and significantly correlated with marketable tuber yield (0.58 and 0.53), marketable tuber number (0.69 and 0.61), average tuber weight (0.71 & 0.66), large tuber weight (0.75 & 0.69), total tuber yield (0.51 & 0.47), and dry matter content (0.77 & 0.28) both at genotypic and phenotypic level respectively whereas significantly and negatively correlated with unmarketable tuber yield (-0.69 and -0.61), small tuber number (-0.73 & -0.66), medium tuber weight (-0.82 & -0.75), small tuber weight (-.0.77 & -0.68) at genotypic and phenotypic level respectively. It is also negatively and significantly correlated with unmarketable tuber yield (-0.5) at genotypic level where as non-signicant at phenotypic level (Table 1).
Path analysis
Table 2:Genotypic and phenotypic path coefficient analysis (Diagonal value indicates direct effect; above and below the diagonal value indicates indirect effect) among ten yield and yield component traits in potato genotypes
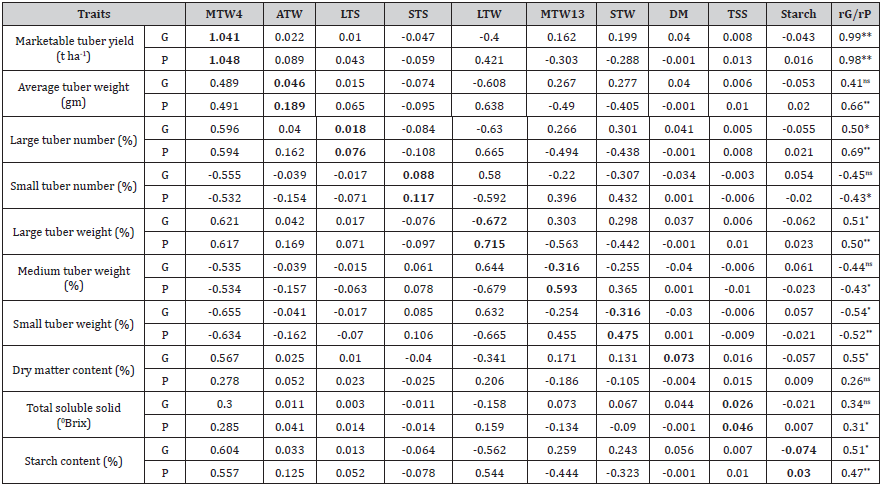
where, G=phenotypic path coefficient analysis; P=phenotypic path coefficient analysis; ns, *, ** = non-significant, Significant at 5% and 1%, respectively; rG-Genotypic correlation with total tuber yield (t ha-1); rP-Phenotypic correlation with total tuber yield (t ha-1); Genotypic Residual effect = 0.0021 & Phenotypic Residual effect 0.0248;
Path coefficient analysis was performed to divide the correlation coefficients between tuber yield and yield related traits into direct and indirect effects via pathways (Table 2). The result revealed that out of fifteen characters studied, marketable tuber yield (1.041 and 1.048), exerted maximum positive direct effect on total tuber yield per plot at genotypic and phenotypic levels, respectively (Table 2). This indicates that if other factors are held constant, an increase in marketable tuber yield will reflect on increased total tuber yield per plot. Average tuber weight (0.046), large tuber number (0.018), dry matter content (0.0173) and starch content (0.026) had positive direct effect on total tuber yield per plot at genotypic level, and average tuber weight (0.189), large tuber number (0.076), small tuber number (0.117), large tuber weight (0.715), marketable tuber yield (0.593), small tuber weight (0.475), total soluble solid (0.046) and and starch (0.03) had positive direct effect on total tuber yield per plot at phenotypic level. On the other hand large tuber weight (-0.672), medium tuber weight (-0.316), and starch content (-0.074) had negative direct effect on total tuber yield per plot at genotypic level, and dry matter content (-0.004) had negative direct effect on total tuber yield per plot at phenotypic level (Table 2).
Cluster analysis
To investigate the genetic relationship of 18 potato genotypes, cluster analysis was conducted and dendrogram was generated using fifteen yield and yield related quantitative traits data (Figure 1). Genotypes were grouped into two main clusters (Figure 1). The first main clusters contained seven verities and bifurcated into two different sub-clusters. The first sub-cluster of the first main cluster consists of one variety viz., Belete which is characterized by the highest in total tuber yield (t ha-1), marketable tuber yield, large tuber number, large tuber weight; and average tuber weight, dry matter content, total soluble solid, and starch content; whereas lowest in small tuber weight, and small tuber number. The second sub-cluster of the first main cluster consists of six varieties namely Gera, Zemen, Bubu, Gorebella, Moti, and Ararsa. These seven released varieties were characterized by high in large tuber number, large tuber weight, and average tuber weight; and good in total tuber yield; whereas low in unmarketable tuber weight, unmarketable tuber number, small tuber weight and small tuber number (Figure 1).
Figure 1: Cluster denderogram describing variation among eighteen potato genotypes using yield and yield component trait data.
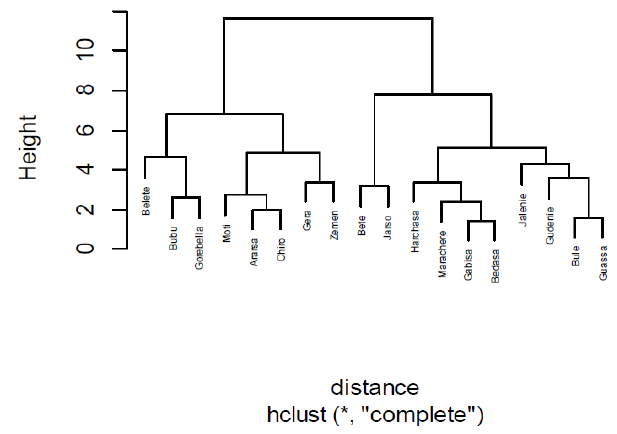
The second main cluster incorporated eleven potato genotypes and bifurcated into two different sub-clusters. The first sub-cluster of the second main cluster consists of two local cultivars (Jarso & Bete) which were characterized by highest in unmarketable tuber weight (%), unmarketable tuber number (%), small tuber weight (%) and small tuber number (%); lowest in total tuber yielder (t ha-1), marketable tuber yield (t ha-1), marketable tuber number (%), large tuber number (%), large tuber weight (%), dry matter content (%) & starch content (%). The second sub-cluster of the second main cluster consisted of nine potato varieties, which were further clustered in to two sub-sub clusters. The first sub-sub-cluster of the second sub-cluster consisted four potato varieties namely, Harchasa,, Marachere, Bedasa and Gabisa which were characterized by high total tuber yield; average marketable tuber number (%), marketable tuber weight (%), marketable tuber size (%), large tuber weight (%) and Starch Content (%); and low in dry matter content (%) & total soluble solid (0Brix). The second sub-sub-cluster consisted three potato genotypes namely, Guwassa, Bule and Jalenie, which were characterized by high in medium tuber weight (%); average in starch content (%), dry matter content (%) & total soluble solid (0Brix); poor in total yielder (t ha-1), marketable tuber yield (t ha-1), marketable tuber number (%), large tuber number (%), and large tuber weight (%). Genetic variation among potato genotypes might contribute to the occurrence of different clusters. Existence of genetic diversity and clustering of potato genotypes in diverse groups were reported by different researcher for different traits [17-20].
Principal component analysis
The principal component analysis of eighteen potato genotypes based on correlation matrix of yield and yield related traits generated the fifteen eigenvalues and eigenvectors. However, based on Amare et al., [21] as cited from Kaiser (1960), factors to be retained should have more than 1 eigenvalues, at least 5% variance explained for each component, and/or more than 70% cumulative proportion of variance explained. Accordingly, the first five components that explained 92.2 % of total variation were used for displaying characters (Table 3).
Table 3:Eigenvalues, present variance and cumulative variance for 15 quantitative characters in Potato.
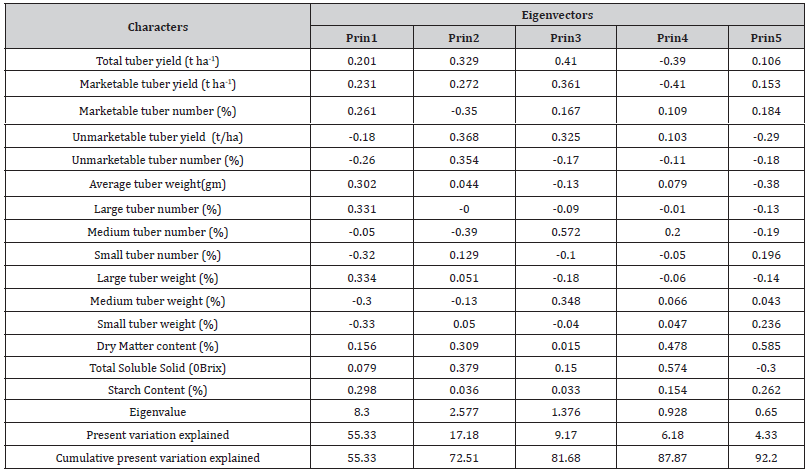
The first principal component explained 53.33% of the variation and total tuber yield, marketable tuber yield, marketable tuber number, average tuber weight, large tuber number & large tuber number were the most important traits contributing more to the variation and this component was more associated with the high values of the above traits positively. In first principal component unmarketable tuber yield, unmarketable tuber number, medium tuber number, small tuber number, medium tuber weight and small tuber weight traits were negatively associated. These elements may be interpreted as the relative weight given to the variables in each component and important variable are those which possess high positive and high negative weight (Jeffers, 1967) and the sign indicates the direction of the relationship between the components and the characters [22]. Due to more variation explained by the PC 1 (Table 3), its scores could effectively represent the variety effect [23].
The second principal component explained 17.18% of the variation and this variation was mainly accredited by Medium tuber number, total soluble solid, unmarketable tuber yield, unmarketable tuber number, total tuber yield and dry matter content. The third principal component explained 9.17% of the total variation and this variation is mainly contributed by medium tuber number, and total tuber yield. The fourth and fifth principal component explained 6.18% & 4.33% respectively. High variation in fourth PC attributed by total soluble solid, dry matter content, & marketable tuber yield (t ha-1) whereas high variation in fifth PC attributed by dry matter content & average tuber weight (Table 1) [24].
From this result it may be concluded that important variables in potato genotypes with respect to agronomic traits were total tuber yield, marketable tuber yield, marketable tuber number, average tuber weight, large tuber number & large tuber number. The above-mentioned variables might be taken into consideration for effective selection of parents.
Summery and Conclusion
According to this study result, total tuber yield was significantly and positively correlated with marketable tuber yield, large tuber number, large tuber weight, and starch content, while negatively and significantly correlated with small tuber weight both at the genotypic and phenotypic level. In this study, path analysis indicated that total tuber yield was directly associated with marketable tuber yield, average tuber weight, large tuber weight, large tuber number, dry matter content, total soluble solids, and starch content. The studied 18 potato genotypes were distributed into different clusters confirming the existence of a high genetic divergence among the studied genotypes. The principal component analysis showed that the first eight principal components accounted for 92.2% among 18 potato genotypes for the seventeen quantitative traits. The major traits contributing to these observed variations among the studied genotypes were total tuber yield, marketable tuber yield, marketable tuber number, average tuber weight, large tuber number, & large tuber number contributing 53.33%. As a result, the genotypes could be used as contrasting parents for further breeding programs. The yield of these genotypes could be improved by either crossing these divergent landraces with each other or by selection focusing on major traits. Many of the characters in this study showed positive and negative correlated with each other [25]. In conclusion, the traits that are directly associated with tuber yield should be considered in selection at potato improvement programs that aim to increasing tuber yield. Variety Belete, which was grouped in the first sub-cluster of the first main cluster, was the most superior yielder variety among the tested varieties and local cultivars and therefore could be exploited in potato breeding to improve total tuber yield.
Acknowledgement
None.
Conflict of Interest
No conflict of interest.
References
- FAOSTAT (Food and Agriculture Organization of the United Nations), FAOSTAT (Statistical Database) (2022) Countries - Select All; Regions - World + (Total); Elements Production Quantity; Items - Potatoes; Years - 2020.
- Adane Hirpa, Miranda PM Meuwissen, Agajie Tesfaye, Willemien JM Lommen, Alfons Oude Lansink, et al. (2010) Analysis of Seed Potato Systems in Ethiopia. Am J Pot Res 87: 537-552.
- CSA (2019/20) Agricultural Sample Survey Report on Area and Production (Private Peasant Holdings Meher Season. Central Statistical Agency of Ethiopia, Statistical Bulletin Addis Ababa, Ethiopia.
- FAOSTAT (Food and Agriculture Organization of the United Nations), FAOSTAT (Statistical Database) (2019) Countries - Select Ethiopia; Elements - Production Quantity; Items - Potatoes; Years - 2017.
- Tekalign T, PS Hammes (2005) Growth and productivity of potato as influenced bycultivar and reproductive growth II, Growth analysis, tuber yield and quality. Scientia Horticulturae 105: 29-44.
- Mondal MAA (2003) Improvement of potato (Solanum tuberosum L.) through hybridization and in vitro culture technique. PhD Thesis. Rajshahi University, Rajshahi, Bangladesh.
- Ali F, Kanwal N, Ahsan M, Ali Q, Bibi I, et al. (2015) Multivariate analysis of grain yield and its attributing traits in. different Maize Hybrids Grown under Heat and Drought Stress. Scientifica, pp. 1-6.
- Jolliffe I (2002) Principal component analysis (2 ed., pp. pp. 487). Springer.
- Mohammadi S, Prasanna B, Singh N (2003) Sequential path model for determining interrelationships among grain yield and related characters in maize. Crop Science 43(5): 1690-1697.
- Punitha B, Vindhiyavarman P, Manivannan N (2010) Genetic divergence study in sunflower (Helianthus annuus L.). Electron J Plant Breed 1(4): 426-430.
- Kumar MP, B Bharat, NB Hari, NS Bhupendra, K Arun (2013) Analysis of yield components and their association for enhancing grain yield in bread wheat (Triticum aestivum L. em Thell.) under salinesodicity reclaimed condition. J Wheat Res 5: 35-38.
- Khayatnezhad M, Shahriari R, Gholamin R, Jamaati-E-Somarin S, Zabihi-E-Mahmoodabad R (2011) Correlation and Path Analysis Between Yield and Yield Components in Potato (Solanum tubersum L.). Middle-East Journal of Scientific Research 7(1): 17-21.
- Sattar MA, N Sultana, MM Hossain MHR, AKMAI (2007) Genetic Variability, Correlation and Path analysis in Potato (Solanum Tuberosum L.). Bangladesh Journal of Plant Breeding and Genetics 20(1): 33-38.
- Srinivasa KSLV, Ali S, Lakshmana DD (2019) Correlation and Path Analysis for Yield and Yield-Related Traits of Potato (Solanum tuberosum L.) in Karnataka. National Academy Science Letters, 0-3.
- Sultana N, Islam AKMA (2007) Genetic Variability, Correlation and Path Analysis in Potato (Solanum tuberosum L.).
- Sv A, Sm H (2022) Studies on correlation and path analysis in potato (Solanum tuberosum L.) Genotypes. 11(2): 2855-2860.
- Ahmadizadeh M, Felenji H (2011) Evaluating Diversity among Potato Cultivars Using Agro-Morphological and Yield Components in Fall Cultivation of Jiroft Area 11(5): 655-662.
- Lohani M, Singh D, Singh JP (2012) Genetic diversity assessment through principal component analysis in potato (Salamun tuberosun L.). 39: 207-209.
- Panigrahi KK, Sarkar KK, Baisakh B, Mohanty A (2014) Assessment of Genetic Divergence in Potato (Solanum Tuberosum L.) Genotypes for Yield and Yield Attributing Traits. Pp. 247-253.
- Seid E, Mohammed W, Abebe T (2021) Genetic Diversity based on Cluster and Principal Component Analyses in Potato (Solanum Tuberosum L.) for Yield and Processing Attributes. 8: 1-6.
- Amarea B, F Abayb, Y Tsehaye (2018) Interrelationships of Sweet Potato Varieties and their Characters for Yield Determination. International Journal of Sciences 37(2): 261-274.
- Yemane Tsehaye, Fassil Kebebew (2002) Morphological diversity and geographic distribution of adaptive traits in finger millet (Eleusine coracana (L.) Gaertn. Subsp. coracana [Poaceae]) populations from Ethiopia. Addis Ababa, Ethiopia.
- Ali MK, Akinci C, Donmez E (2011) Assessment of genotype x environment interaction on yield and yield components of durum wheat genotypes by multivariate analyses. African Journal of Biotechnology 10(15): 2875-2885.
- Pereira JW, Silva ECA, Luz LN, Nogueira RJMC, Lima LM, et al. (2015) Cluster analysis to select peanut drought tolerance lines. Australian Journal of Crop Science 9(11): 1095-1105.
- SAS Institute (2015) Base SAS® 9.4 procedures guide: Statistical Procedures (3rd, pp. 549).
-
Habtamu Gebreselassie* and Leta Ajema. Correlation, Path Coefficient and Multivariate Analysis for Yield and Yieldassociated Traits among Potato (Solanum tuberosum L.) Genotypes Grown in Eastern Ethiopia. World J Agri & Soil Sci. 8(2): 2022. WJASS.MS.ID.000684.
-
Potato, Correlation, Path analysis, Diversity, Cluster, Principal component analysis, Tuber yield
-

This work is licensed under a Creative Commons Attribution-NonCommercial 4.0 International License.


